Hello Ashford Property Investors,
The past 12 months have been a tumultuous time for the property market. What with the changes to legislation regarding things such as the eviction ban, EICR legislation and more making the market an increasingly challenging environment, things like the stamp duty holiday and home working has led to a significant increase in prices and change to the market in general.
But what have the specific changes been for the Ashford market? Have they been positive, negative or neutral and how does this compare to the 2008 financial crisis. As the Land Registry data to December 2020 has just been released, I have been taking some time to look into the data and it makes for very positive reading for local investors!
Before looking specifically at the past 12 months, I thought I would take a look at the past two decades and was impressed to see how Ashford prices had increased by a total of 252% or £223,463! That’s £931 for every month since the year 2000.
This growth demonstrates how strong the growth can be when you make the decision to invest in property!
The past 12 months show a particularly encouraging trend, as the Land Registry reports that Ashford property prices have increased by over 5% (£15,258) between January and December 2020 when compared to just 3% for London, but broadly in line with Kent which also increased by just over 5%.
When we look at the change in work environment, I recently read an article from home.co.uk that quoted director Doug Shephard comparing London to the suburbs.
Doug explained: “It is highly noteworthy that, despite the COVID driven exodus from central urban areas, the more leafy suburbs of London remain highly popular with homebuyers. So too are the well-connected property-boom towns of Ashford, Bristol and Sale (Greater Manchester)…”
Whilst I was unable to find data relating to the level of rental arrears, it is certainly interesting to highlight how unemployment in Ashford has hit 6% and whilst this is by far not the worst area in Kent (with Thanet at 10.2%), it represents a rise of 121% between December 2019 and December 2020; slightly above the UK average increase of 117%.
Kent Unemployment Rate Jan 2007 – October 2020
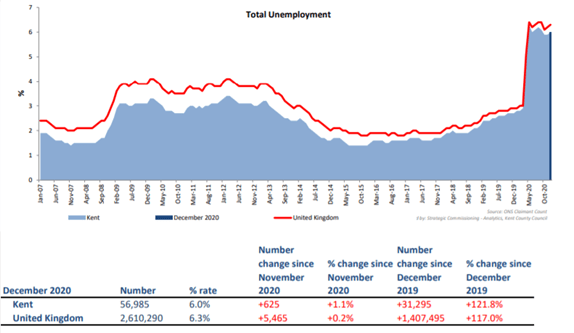
This graph really does paint a picture, outlining how unemployment has skyrocketed to an eye wateringly high level over the past 12 months! Generally, a rise in unemployment leads to things such as a drop in house prices, rise in repossessions and growth in problems such as rental arrears. I thought that the graph below would be interesting to help illustrate this!
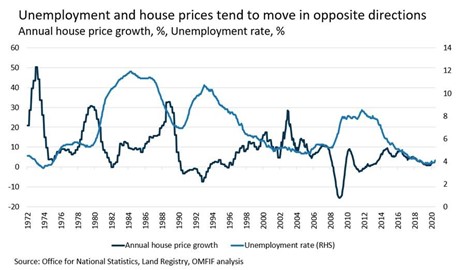
What has happened over the past 12 months however, is certainly almost extraordinary, as Ashford property prices have skyrocketed and this falls outside of this trend of rising unemployment and drop in house price growth. I thought it would be interesting to compare Ashford house prices between 2008-2009 and 2019 – 2020 as they pretty much mirror one another!

This is certainly a unique situation and has led to investors rightly being cautious! Considering the demand fuelled by the stamp duty holiday, we may see a drop however if we follow the previous pattern of reducing unemployment and increasing prices it could mean that we are in for an ongoing increase.
So this brings us to the million-dollar question. How has COVID-19 affected the Ashford property market? Well, I think the answer here is, at the time being, a slightly uncertain one and something that history will tell better than we can right now!
What we do know however is that the recent increase in prices helps demonstrate the value of investing in property and doing so for the long term.
As your local HMO specialist, I will be keeping a close eye on the Ashford property market over the coming months and compile a further report later in the year that I trust you will find helpful!
Hasan
